Nobody can possibly know everything about the show, but one may try!
Detailed Temple Run Statistics by Team
Idea by "Madelynne Rabb"
The number before the slash is the number of times the team won; the number after the slash is the total number of times the team made it to the temple. If a box is blank, then that team did not make it to the temple in that particular layout.
Red Jaguars
Blue Barracudas
Green Monkeys
Orange Iguanas
Purple Parrots
Silver Snakes
Totals
Season 1, Layout 1
0/1
1/1
1/2 (50%)
Season 1, Layout 2
0/1
1/1
0/2
1/4 (25%)
Season 1, Layout 3
1/2
1/1
1/2
3/5 (60%)
Season 1, Layout 4
1/3
0/1
1/4 (25%)
Season 1, Layout 5
0/2
0/1
0/1
0/1
0/1
0/6 (0%)
Season 1, Layout 6
0/2
1/1
0/2
1/5 (20%)
Season 1, Layout 7
1/2
0/1
0/1
0/1
1/5 (20%)
Season 1, Layout 8
0/1
0/1
0/1
1/2
1/5 (20%)
Season 1, Layout 9
0/1
1/1
2/2
3/4 (75%)
Season 1 Totals
2/10 (20%)
3/7 (42.9%)
2/4 (50%)
0/6 (0%)
0/2 (0%)
5/11 (45.4%)
12/40 (30%)
Season 2, Layout 1
1/3
1/3 (33.3%)
Season 2, Layout 2
0/1
2/4
1/2
1/4
0/1
4/12 (33.3%)
Season 2, Layout 3
0/3
0/2
1/2
0/1
0/2
1/2
2/12 (16.7%)
Season 2, Layout 4
0/1
0/1
1/2
1/4 (25%)
Season 2, Layout 5
0/1
0/1
1/2
1/2
0/3
2/9 (22.2%)
Season 2 Totals
0/6 (0%)
2/7 (28.6%)
2/5 (40%)
3/10 (30%)
2/7 (28.6%)
1/5 (20%)
10/40 (25%)
Season 3 Totals
2/4 (50%)
0/5 (0%)
4/15 (26.7%)
1/9 (11.1%)
1/2 (50%)
2/5 (40%)
10/40 (25%)
GRAND TOTALS
4/20 (20%)
5/19 (26.3%)
8/24 (33.3%)
4/25 (16%)
3/11 (27.2%)
8/21 (38.0%)
32/120 (26.7%)
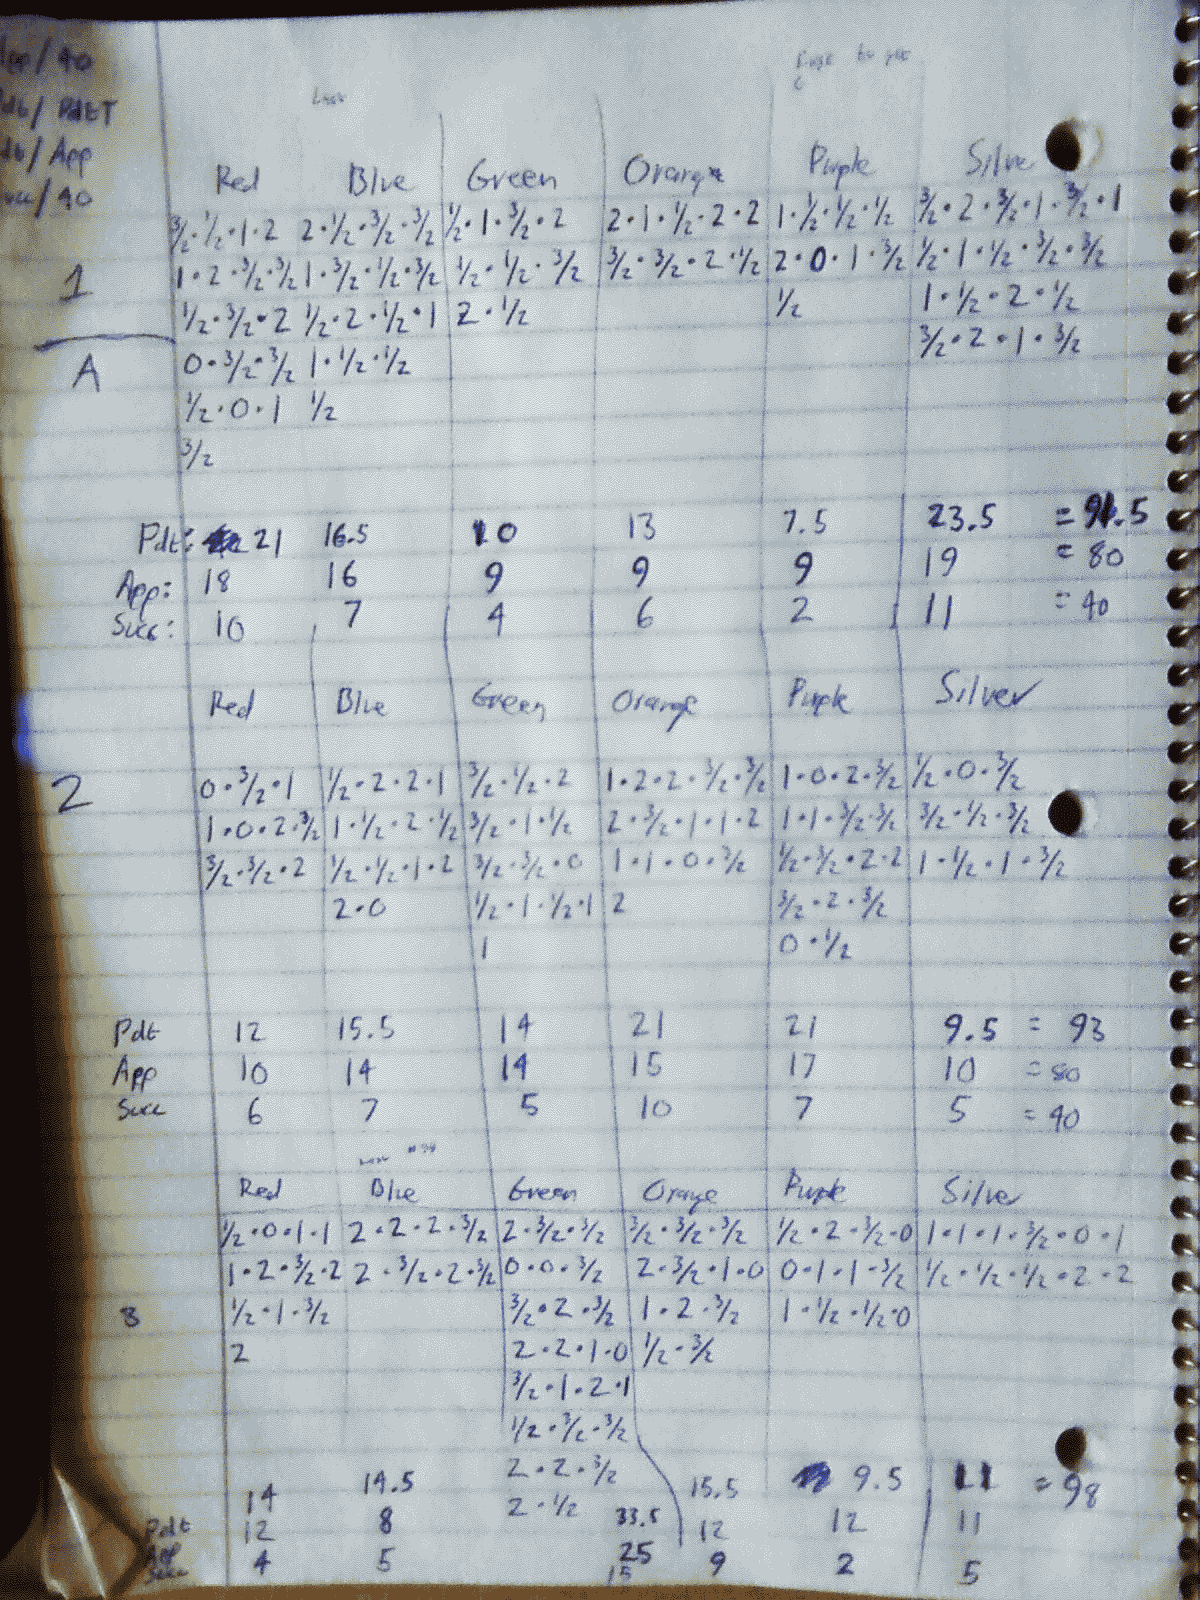
Detailed Temple Game Statistics
This table should be used by Legends pros only.
Each team's ratio of Temple Game appearances should approximate 33.3% since one-third of teams make it to the Temple Games in each episode.
The Pendants won ratio should approximate 16.7% for each team if all teams split the Pendants evenly.
The Temple Run ratio should approximate 16.7% for each team if all teams are equally likely to pass to the Temple.
The Temple Runs per Temple Game appearance ratio should approximate 50% if the two contesting teams have an equal chance of winning.
Interesting note: The Iguanas had the most Temple Runs but were tied for the fewest Temple Games appearances.
Interesting note: The Barracudas never won fewer than 1 1/2 Pendants in the Temple Games round for the entire third season.
There are a lot of numbers in this table, so it's prone to mistakes. If you'd like to check my work, click here to see my original notes. Note that one of the 2s for the Blue Barracudas in Season 3 should have been in the Orange Iguanas' column. This table reflects the proper correction.
Red Jaguars
Temple Game Appearances
Pendants Won / Season Total
Pendants / Appearance
Temple Runs / Episode
Temple Runs / TG Appearance
Season 1 Totals
18/40 (45%)
21/91.5 (23.0%)
21/18 (1.17)
10/40 (25%)
10/18 (55.6%)
Season 2 Totals
10/40 (25%)
12/93 (12.9%)
12/10 (1.2)
6/40 (15%)
6/10 (60%)
Season 3 Totals
12/40 (30%)
14/98 (14.3%)
14/12 (1.17)
4/40 (10%)
4/12 (33.3%)
Jaguar Totals
40/120 (33.3%)
47/282.5 (16.6%)
47/40 (1.18)
20/120 (16.7%)
20/40 (50%)
Blue Barracudas
Temple Game Appearances
Pendants Won / Season Total
Pendants / Appearance
Temple Runs / Episode
Temple Runs / TG Appearance
Season 1 Totals
16/40 (40%)
16.5/91.5 (18.0%)
16.5/16 (1.03)
7/40 (17.5%)
7/16 (43.8%)
Season 2 Totals
14/40 (35%)
15.5/93 (16.7%)
15.5/14 (1.11)
7/40 (17.5%)
7/14 (50%)
Season 3 Totals
7/40 (17.5%)
12.5/98 (12.8%)
12.5/7 (1.79)
5/40 (12.5%)
5/7 (71.4%)
Barracuda Totals
37/120 (30.8%)
44.5/282.5 (15.8%)
44.5/37 (1.20)
19/120 (15.8%)
19/37 (51.4%)
Green Monkeys
Temple Game Appearances
Pendants Won / Season Total
Pendants / Appearance
Temple Runs / Episode
Temple Runs / TG Appearance
Season 1 Totals
9/40 (22.5%)
10/91.5 (10.9%)
10/9 (1.11)
4/40 (10%)
4/9 (44.4%)
Season 2 Totals
14/40 (35%)
14/93 (15.1%)
14/14 (1)
5/40 (12.5%)
5/14 (35.7%)
Season 3 Totals
25/40 (62.5%)
33.5/98 (34.2%)
33.5/25 (1.34)
15/40 (37.5%)
15/25 (60%)
Monkey Totals
48/120 (40%)
57.5/282.5 (20.4%)
57.5/48 (1.20)
24/120 (20%)
24/48 (50%)
Orange Iguanas
Temple Game Appearances
Pendants Won / Season Total
Pendants / Appearance
Temple Runs / Episode
Temple Runs / TG Appearance
Season 1 Totals
9/40 (22.5%)
13/91.5 (14.2%)
13/9 (1.44)
6/40 (15%)
6/9 (66.7%)
Season 2 Totals
15/40 (37.5%)
21/93 (22.6%)
21/15 (1.4)
10/40 (25%)
10/15 (66.7%)
Season 3 Totals
13/40 (32.5%)
17.5/98 (17.9%)
17.5/13 (1.35)
9/40 (22.5%)
9/13 (69.2%)
Iguana Totals
37/120 (30.8%)
51.5/282.5 (18.2%)
51.5/37 (1.39)
25/120 (20.8%)
25/37 (67.6%)
Purple Parrots
Temple Game Appearances
Pendants Won / Season Total
Pendants / Appearance
Temple Runs / Episode
Temple Runs / TG Appearance
Season 1 Totals
9/40 (22.5%)
7.5/91.5 (8.2%)
7.5/9 (0.83)
2/40 (5%)
2/9 (22.2%)
Season 2 Totals
17/40 (42.5%)
21/93 (22.6%)
21/17 (1.24)
7/40 (17.5%)
7/17 (41.2%)
Season 3 Totals
12/40 (30%)
9.5/98 (9.7%)
9.5/12 (0.79)
2/40 (5%)
2/12 (16.7%)
Parrot Totals
38/120 (31.7%)
38/282.5 (13.5%)
38/38 (1)
11/120 (9.2%)
11/38 (28.9%)
Silver Snakes
Temple Game Appearances
Pendants Won / Season Total
Pendants / Appearance
Temple Runs / Episode
Temple Runs / TG Appearance
Season 1 Totals
19/40 (47.5%)
23.5/91.5 (25.7%)
23.5/19 (1.24)
11/40 (27.5%)
11/19 (57.9%)
Season 2 Totals
10/40 (25%)
9.5/93 (10.2%)
9.5/10 (0.95)
5/40 (12.5%)
5/10 (50%)
Season 3 Totals
11/40 (27.5%)
11/98 (11.2%)
11/11 (1)
5/40 (12.5%)
5/11 (45.5%)
Snake Totals
40/120 (33.3%)
44/282.5 (15.6%)
44/40 (1.1)
21/120 (17.5%)
21/40 (52.5%)
GRAND TOTALS
282.5/240 (1.18)
Detailed Temple Run Statistics by Pendants Won
The number before the slash is the number of times the teams won; the number after the slash is the total number of times the teams made it to the temple. If a box is blank, then there were no temple runs in that layout where that number of pendants was won. Numbers enclosed in brackets show the number of times a team acquired the hidden half pendant in the temple.
1 Pendant
1 1/2 Pendants
2 Pendants
Totals
Season 1, Layout 1
1/1
0/1
1/2 (50%)
Season 1, Layout 2
0/2
1/2
1/4 (25%)
Season 1, Layout 3
0/2
2/2
1/1
3/5 (60%)
Season 1, Layout 4
1/4
1/4 (25%)
Season 1, Layout 5
0/2
0/4
0/6 (0%)
Season 1, Layout 6
0/2 [1]
1/3
1/5 [1] (20%)
Season 1, Layout 7
0/1
1/3 [1]
0/1
1/5 [1] (20%)
Season 1, Layout 8
0/3
1/2
1/5 (20%)
Season 1, Layout 9
1/1
1/2 [1]
1/1
3/4 [1] (75%)
Season 1 Totals
1/4 (25%)
6/21 [3] (28.6%)
5/15 (33.3%)
12/40 [3] (30%)
Season 2, Layout 1
1/1
0/2
1/3 (33.3%)
Season 2, Layout 2
2/3
1/4 [1]
1/5
4/12 [1] (33.3%)
Season 2, Layout 3
2/8 [3]
0/4
2/12 [3] (16.7%)
Season 2, Layout 4
0/1
1/3
1/4 (25%)
Season 2, Layout 5
0/2
1/4 [3]
1/3
2/9 [3] (22.2%)
Season 2 Totals
3/6 (50%)
4/17 [7] (23.5%)
3/17 (17.6%)
10/40 [7] (25%)
Season 3 Totals
2/5 (40%)
5/14 [3] (35.7%)
3/21 (14.3%)
10/40 [3] (25%)
GRAND TOTALS
6/15 (40%)
15/52 [13] (28.8%)
11/53 (20.8%)
32/120 [13] (26.7%)
Detailed Temple Run Statistics by Room Location
The number before the slash is the number of times the teams won when the artifact was hidden in a particular room; the number after the slash is the total number of times the artifact was hidden in that room. If a box is blank, then there were no temple runs in that layout where that room was used to house the artifact.
The "room locations" referred to in the following chart do not refer to individual rooms, but the place they held. In the chart, they are listed in the same order as Olmec read them in Season 3. The names used in the chart below are not official designations.
